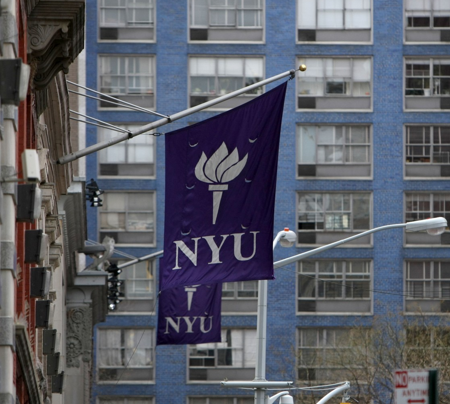
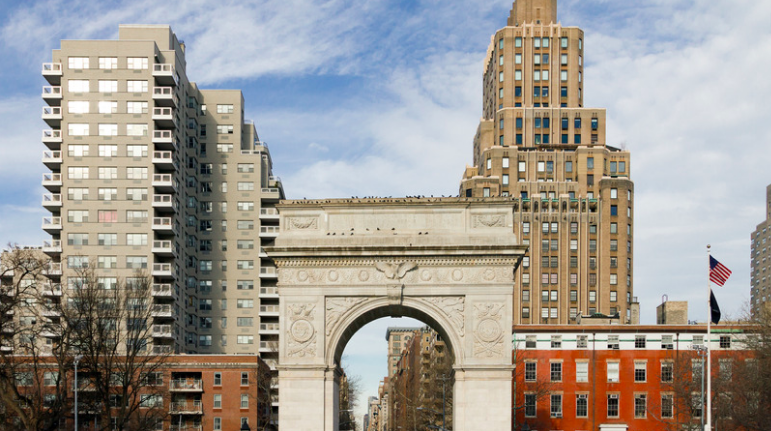
Admissions Blog

Undergraduate Admissions Uncensored

  • admissions.blog

12 Reasons Scattergrams Lull Students Into a False Sense of Security

Posted on September 19, 2022 by Craig Meister Leave a Comment

Scattergrams, the ubiquitous x/y axis graphs that have caught on like wildfire over the last twenty-five years because of their inclusion in Naviance, MaiaLearning, Cialfo, and other online college counseling tools used by thousands of American high schools. Scattergrams purport to show a student’s chances of admission at different colleges and universities by plotting previous students from a particular high school on an x/y axis graph based on such students’ GPAs on one axis and their test scores (ACT or SAT) on the other.

Below is an example of a scattergram for a particular high school showing current students (and parents) at that high school how alumni from that high school fared when applying to University of Maryland College Park from 2010 through 2014.

Two images of scattergrams are included below. On the first one, from Naviance, please note that the scattergram plots the SAT on the x-axis using the old 2400 SAT scale; however, the SAT these days is scored out of 1600. Similarly, the first scattergrams’s high school clearly plots GPA based on a 4.0 scale, but some schools’ scattergrams will have very different numbers of the y-axis because scattergrams can have any sort of GPA scale on them (100, 20, 6, etc.) depending on a school’s grading scale.

The second scattergram image is from Cialfo and captures data for Reed College. It at least shares whether the data plotted represents students who applied Early Decision vs. vs. Early Action vs. something else (which at Reed would be Regular), which some scattergrams don’t share.

The typical student seeing the first of the two  scattergrams above assumes, if he or she has a 3.6 GPA and an SAT score of 1860 he or she is definitely going to get into University of Maryland College Park. Most of the rest of students with that combination of grades and scores would assume, after seeing the above scattergram, that Maryland is at least a huge safety college for them. After all, all students from this high school in the past few years who land in that GPA/score range got into Maryland, as illustrated by all of those green squares.

STOP RIGHT THERE!

The problem is a student with this GPA/score combination could easily get rejected from University of Maryland College Park for any number of reasons that a scattergram will not be able to display. The most common reasons scattergrams lull students into a false sense of security are as follows:

  1. Many selective colleges get more selective every passing year, rendering antiquated past years’ admissions statistics.
  2. Scattergrams don’t show the quality of past applicants’ extracurricular resumes.
  3. Scattergrams don’t show the quality of past applicants’ essay writing skills.
  4. Scattergrams don’t show past applicants’ demographics (rich, middle-class, poor, black, white, Hispanic, Asian, International, etc.). College admissions officers for American colleges – especially selective institutions – often care quite a lot about their applicants’ demographics.
  5. Scattergrams don’t show incredibly important (again, in the eyes of college admissions officers) background information about past applicants’ beyond their demographics. Here we are talking about characteristics like an applicant’s legacy status (Did a past applicant’s mom or dad attend the same college?), athletic prowess (Was a past applicant a highly-sought athletic recruit?), and/or his or her parents’/grandparents’ proclivity for giving money to the college on the scattergram in question.
  6. Most high schools set their scattergrams to hide from current students/parents whether or not past applicants to the college in question applied Rolling Decision, Early Decision, Early Action, Priority Admission, and/or Regular Decision. That’s important information! This is because colleges that offer different admissions plans/deadlines often have very different standards for each such plan/deadline. You can also forget about a scattergram showing whether a past applicant applied for and/or was accepted to the college for fall, spring, or winter term (if such varied options exist at the college in question).
  7. Scattergrams don’t show the quality of past applicants’ teacher and counselor recommendation letters/evaluations.
  8. Scattergrams likely don’t account for whether or not past applicants submitted their ACT scores, SAT scores, both, or neither (in the case of test-optional colleges) to the colleges’ scattergrams on which they are plotted. This is a huge issue in a college admissions environment where there majority of colleges continue to be test-optional.
  9. Unless the scattergram’s GPA axis is a weighted GPA, the GPA axis is not capable of communicating to students and parents the past applicants’ curricular rigor.
  10. Scattergrams don’t show past applicants’ grade trends in high school (colleges care so much about this).
  11. Scattergrams show past applicants’ final GPAs in high school, not their GPAs when they applied to college (usually in the beginning of a student’s senior year). Senior slumps in the final months of past applicants’ senior years often slightly (and sometimes greatly) deflate their final GPAs relative to what their GPAs were in October of their senior years.
  12. Directors of college counseling (the leaders of college counseling offices) can be applicants’ best advocates or worst enemies depending on whether or not these directors have written a strong and compelling high school profile and done everything else they can do to encourage particular colleges to accept their students. Scattergrams don’t note when certain directors’ regimes began and ended; therefore, in a field where many directors of college counseling only stay in their roles for a few years before moving on, a five- or ten-year scattergram could be capturing admissions statistics for students applying from a particular high school under very different college counseling regimes. Some directors write bang-up high school profiles (which are sent to all colleges to which students apply in a particular admissions cycle) and some don’t. Sadly, at some schools, the high school profile is written and designed by the communications team and/or individuals in the admissions, advancement, development, head of school, principal, and or central office! The further removed from college counseling the writers of the high school profile are the more likely the profile will not provide college admissions officers the information they are looking for in a high school profile. Meanwhile, some directors of college counseling make calls for their students or their colleagues’ students, others simply don’t. Some are on a first-name basis with Ivy League admissions officers, some don’t know any. Some act as PR agents for their students, others are real in their recommendation letters, which leads to such letters carrying more weight with admissions officers than those that only share glowing reviews. Scattergrams lull students and parents into thinking (just like point #1 above) that each student plotted on the scattergram had the same college counseling team behind him or her and faced the same college admissions rates from year to year. The fact is, high schools change and colleges change, and as a result, scattergrams fail at capturing subtle or quite large subjective changes to students’ chances from year to year based on how high schools and colleges change.

In summary, so much of what colleges will ultimately base their admissions decisions on is NOT captured in scattergrams; therefore, don’t use them as the end all be all when it comes to determining whether a particular college on your list is a Safety, Possible, or Reach. Any college counselor, student, or parent who tells you otherwise has no idea what he or she is talking about.

I frequently get irate parents telling me that I am too pessimistic about their student’s chances at a particular college or university based on what the family sees on a particular college’s scattergram on Naviance, MaiaLearning, or Cialfo. I remind them that I often know the back story on each applicant on the scattergram and/or that there are at lease twelve reasons why the scattergram is only part of the story – especially at the country’s most selective colleges and universities. Sadly, this does not often calm the parents down, and as a result, a few parents hold months-long bouts of resentment towards me – usually until all admissions decisions are released in April, at which point reality sets in – for good or ill. With that said, I am happy when I have a student get into a college that I classified as a Reach that the parents and student thought I should have classified as a Possible or a Safety. It’s my job to help turn all colleges on a student’s list into offers of admission; yet, I need the student’s cooperation and effort if I can make this happen. Sometimes that happens, and sometimes it doesn’t.

Scattergrams are trustworthier for colleges that primarily base their admissions decisions on applicants’ grades and scores only. Theses types of colleges were usually those that accepted over 50 of applicants and/or large state universities that asked for the perfunctory essay and extracurricular list but which didn’t have the actual manpower to review these subjective aspects of students’ applications. Such colleges simply defaulted to determining whether or not to accept a student based on his or her scores and grades. Yet, such colleges are increasingly rare because of the current trend of test-optional admissions that is sweeping the nation. Even in such cases where grades and test scores make of the majority of a college’s admissions decision, a student who is quite deficient or exceptionally strong in one or more of the twelve areas listed above could easily become an exception to the rule that the scattergram seems to convey.

Bottom line: strong college counselors always explain this important, complex, and as you can now see, somewhat time-consuming information to students and parents. Such college counselors tend to lean towards being more conservative with their Safety, Possible, and Reach classifications for colleges on their students’ lists than those college counselors who take a relatively two-dimensional approach (x,y axis, anyone?) to college acceptance/rejection prognostication. If you are a student or parent going through the college application process now or in the future, please remember to be skeptical of scattergrams. Though they have valuable data on them, scattergrams only capture some objective data, and they certainly don’t capture the subjective strengths or weaknesses of past college applicants or their college applications.

University of Illinois Urbana-Champaign’s Impressive Acceptance Rate Transparency

Posted on September 13, 2022 by Craig Meister

Let’s face it, these days so much of the world of undergraduate admissions is smoke a mirrors. Which makes it particularly noteworthy when a big institution like University of Illinois Urbana-Champaign goes out of its way to be transparent about the fact that it’s a university made up of many different acceptance rates, not just one top-line number. As this site has pointed out for years, many colleges like to cherry pick data to impress or intimidate, which leaves those in the know to have to explain there’s often more to the story. If only more colleges behaved as transparently as University of Illinois Urbana-Champaign (UIUC)!

Acknowledging that it’s first year on the Common App shook things up quite a bit, UIUC has now officially shared that received over 63,000 applications, during the 2021-2022 admissions cycle, which is a robust thirty-three percent increase over the 2020-2021 admissions cycle, which was UIUC’s last pre-Common App. As a result, UIUC became much more selective statistically: it only admitted admitting forty-five percent of applicants during the 2021-2022 admissions cycle compared to roughy sixty percent of applicants during the 2020-2021 admissions cycle. In fact, Director of Undergraduate Admissions, Andy Borst, shared, “We came in over our original target, and more international students accepted their offer of admission and enrolled than what we anticipated.”

UIUC now publishes its admit rate by college and for its Computer Science-related programs. Check out these numbers for 2021-2022:

College Admit Rates (First-Choice Major Only)

College of Agricultural, Consumer & Environmental Sciences: 42.8%

College of Applied Health Sciences: 45.5%

College of Education: 51.7%

College of Fine & Applied Arts: 49.5%

College of Liberal Arts & Sciences: 49.8%

College of Media: 38.4%

Division of General Studies: 48.9%

Gies College of Business: 27.0%

Grainger College of Engineering: 23.0%

School of Information Sciences: 68.1%

School of Social Work: 46.9%

Computer Science Programs

Computer Science: 6.7%

Computer Science + X Programs: 25.4%

In terms of acceptance rate by residency, another trove of data colleges routinely hide from the general public, UIUC is not shy about laying it all out there:

Residency Applicants Admits Acceptance Rate
Illinois Resident 25,944 14,589 56.20%
Non-Resident 21,216 7,749 36.50%
International 16,097 6,016 37.40%

While UIUC remains test optional, the university also revealed the percentage of applicants who submitted ACT or SAT scores by college. Over seventy percent of accepted Engineering applicants submitted test scores while fewer than thirty percent of accepted Education and Social Work applicants submitted scores. Wow! Even with these vast disparities, the middle fifty percent of accepted Engineering students earned between 1440 and 1530 while the middle fifty percent of Education students earned between 1220 and 1365 and the middle fifty percent of Social Work students earned between 1260 and 1420. Very interesting indeed!

Borst added, “We encourage students to apply for programs in which they plan to enroll, if admitted. We will only consider students for their first-choice major and their second-choice major, if selected. The Division of General Studies is intended for students who are open to exploring more than one major, with preference given to students who are open to exploring programs with capacity on campus. Students who are only interested in intercollegiate transfer once on campus into The Grainger College of Engineering or Gies College of Business should be encouraged to enroll at another university.”

Also of note, due to University of Illinois Urbana-Champaign’s increasing competitiveness, students are now only able to enter the university’s computer science program as new first-year or transfer students. Students will not be able to apply to change majors into computer science once on campus, although they will still be able to pursue a computer science minor or apply to change majors into the computer science & X programs. To learn more about the differences between UIUC’s computer science major and majors similar to it, check out UIUC’s blog on the subject.

While impressed by all this valuable information, I’d also love to know the breakdown of UIUC’s EA and Regular acceptance rates too. Yet, progress is progress, and more colleges that accept by school or program or that have differentiated acceptance rates by residency should follow University of Illinois Urbana-Champaign’s lead in publishing data like this! Thank you Director Borst and University of Illinois Urbana-Champaign for all of your transparency!

Are you interested in University of Illinois Urbana-Champaign? Watch my team’s visit to campus during which we spoke to real UIUC students about their thoughts on the university:

University of Southern California Adds Early Action Admissions Deadline

Posted on September 9, 2022 by admissions.blog Leave a Comment

The University of Southern California, a selective private university in Los Angeles, has announced that it is introducing a November 1 Early Action admissions deadline for the 2022-2023 admission cycle.

This is a big change for a university that had long held the line on notifying candidates of their admissions decisions no earlier than spring of each year. Now, those students applying Early Action this fall will learn of their admissions decision by mid to late January 2023.

The new November 1 deadline is non-binding (Early Decision, which USC does not offer, is binding) and non-restrictive, which means that students can apply to other colleges Early Action at the same time. Students can even apply to one other college Early Decision at the same time, but of course would need to commit to their Early Decision college if admitted.

Yet, Early Action is not available for students applying to majors in the School of Architecture, School of Cinematic Arts, Kaufman School of Dance, School of Dramatic Arts, Roski School of Art and Design, Iovine and Young Academy, and Thornton School of Music should. Students applying to these schools should apply by December 1 using USC’s Regular Decision plan.

USC has become increasingly selective since going test optional. During the 2021-2022 admissions cycle, USC, which is the largest private university in California, only accepted roughly twelve percent of first-year applicants.

UC Berkeley Announces Fall 2022 Admissions Updates

Posted on August 25, 2022 by Craig Meister Leave a Comment

As we head into a new admissions cycle, University of California, Berkeley is announcing some changes in how it will consider applicants.

UC Berkeley is joining the rest of the UC campuses in allowing students to select an alternative major on the UC application. The university encourages students to take advantage of this option, especially if they have a second-choice major they’re interested in. UC Berkeley’s advice remains that students should select the major they are most interested in as their primary major because the university will only guarantee a review of the primary major, while alternative majors will only be used if space is available, for example, as the university considers available space during the wait list process.

In addition, first-year applicants admitted to one of the twelve high-demand majors in the College of Letters and Science will be guaranteed a space in the major. While this will not be a direct admission to the major, the process to declare will be simplified and space will be held for them contingent on certain requirements. Students interested in a high-demand major are encouraged to apply for it on the application, which gives them the best chance of declaring that major. Students who do not select a high-demand major can apply to declare after enrolling at Berkeley, but it will be through a comprehensive review process directly with the major department.

Meanwhile, any student interested in completing a double major will be limited to one high-demand major in the College of Letters and Science. Students who are interested in more than one major are encouraged to add the high-demand major as their primary major on their UC application. More information related to these changes will be posted on this page in the coming weeks.

This news comes as students are encouraged to start their UC application for fall 2022 this month (August), including entering personal information, self-reporting their courses and grades, and drafting their Personal Insight Questions (PIQs).

Like other UC campuses, starting this cycle, the application submission period for UC Berkeley begins on October 1, and the deadline is November 30. This gives students a larger window to submit their applications, as in previous years the application submission window only lasted for the entire month of November. Once the application is submitted students cannot make changes to the application, so they should plan accordingly, and of course, the UC system does not offer Early Action or Early Decision.

Finally, UC Berkeley also has shared news for prospective transfer students. Starting fall of 2023, participating UC Berkeley academic departments will pilot a direct admit to major program in Berkeley’s College of Letters and Science for transfer admits. There will be twenty-seven departments participating in the program including four high-demand majors: Art Practice, Computer Science, Data Science, and Social Welfare.

On the UC application, when selecting the major, the portal will inform students that they are applying directly to the chosen major. If an applicant is admitted to a major participating in this program they will not have to go through the process of applying to or officially declaring their major during their first semester on campus. Transfer admission and major declaration procedures will not change for majors who are not participating in this pilot program. More information will be posted on this page in the coming weeks as details are finalized.

All of these updates come on the heels of an unprecedented year that included a record number of freshmen applicants to UC Berkeley (over 128,000 applicants) and a court ruling that threatened to cap its enrollment numbers. Even so, the selective Bay Area university offered over 19,700 freshmen and transfer students admission.

Discover Colleges on a Map with College Overlook — and Analyze Your List Geographically

Posted on July 29, 2022 by Bob Poulsen 1 Comment

I’m Bob Poulsen, an Oregon parent of a high school senior.  While researching colleges, I couldn’t find an efficient web tool to display US colleges on a map.  So, being a web designer, I built one!

Let me show you some of the features of College Overlook, my new free web app.

After first viewing a map of all US colleges awarding Bachelor’s Degrees — over 1,700 according to the US Department of Education — accessible filters can then be applied to include or exclude groups of colleges based on size, acceptance rate, governance (public/private/religious), Common App acceptance, and more.  That way you can map only the institutions that interest you most!

Now zoom the map to your desired geographic area, and click on some colleges.  You’ll get a lot of useful data, all provided by the College Scorecard from the US Department of Education.  For tons more additional info click to view College Scorecard directly in a new webpage to examine fields of study, average annual cost, student body demographics, graduation rate, and similar data.
For even more in-depth research into a particular college, click the easy links to open Wikipedia, Google Maps, Niche, and National Center for Education Statistics.  You’re sure to find some relevant info to help you decide if that college might be for you.  You can even click to get the Wikipedia data for the city itself, to help evaluate the larger environment of the college you are considering.
When ready, start building a list of potential colleges.  Click a college to research, and if you like it click the “Star” to set a favorite.  You can mark up to forty favorites.  A menu option shows you all your favorites in the form of a list, which you can also sort by number of undergraduates or acceptance rate.  Add or delete colleges anytime.

To save work for later, click “Save” (the download button with the arrow facing down) and you will get a unique URL that references your list of colleges, and your most recent map view.  Set a bookmark, or share your unique link with others via email or social media.  If you share this link with yourself, you’ll be able to view your work from any device, any time.

So, that’s what I created!

In May, 2022, I published this app on the web at https://CollegeOverlook.com and it’s free for all to use with no account required.  Just jump right in and immediately start finding colleges near you… or colleges far away, or in any US locations that may feel right for you.

PS – The map can also be configured to check for colleges offering Associates Degrees.

Davidson becomes more selective in 2022

Posted on March 31, 2022 by Craig Meister

Davidson University in North Carolina has shared its 2021-2022 admissions cycle statistics, which reveal the small and selective school will remain just as small as ever while becoming slightly more selective. Davidson has the goal of enrolling 530 first-year students for the fall 2022 semester.

Of an overall 6,487 students who applied to Davidson this year, only 1,090 were accepted, 335 of which were accepted through Early Decision 1, Early Decision 2, athletic recruitment, or partnerships with access organizations such as QuestBridge and POSSE. This overall 16.8 percent acceptance rate during the 2021-2022 cycle compares to a 17.1 percent acceptance rate during the 2020-2021 cycle and a 19.5 percent acceptance rate during the 2019-2020 cycle, which was the last time Davidson required all applicants submit their SAT or ACT scores. This cycle only 48 percent of students submitted their test scores though no stats were provided on what percentage of admitted students submitted their test scores this time around. Davidson committed a test-optional policy as a three-year pilot; therefore, it will continue for one more cycle as the university tracks and analyzes data related to test-optional admissions and student performance.

Other statistics shared include that of admitted students, 12 percent will be the first in their family to attend college; 29 percent are domestic students of color; and 10 percent are international students/non-US citizens.

Regular Decision notifications were released on March 26, 2022, and students have until May 1 to deposit.

Davidson University Admissions Stats c/o 2024 c/o 2025 c/o 2026
Total First-Year Applicants 5,615 6,422 6,487
Total Admitted (not including wait list) 1,096 1,101 1,090
Admitted through ED1/ED2/Athletics/Partnerships 289 326 335
Defers from prior year 5 13 9
Percent reviewed with Test Scores 100% 50% 48%
First Generation Students (admitted) 99 123 132
International Students/Non-US Citizens (admitted) 88 83 105
Domestic Students of Color (admitted) 305 344 319

University of Georgia Class of 2026 Stats

Posted on March 19, 2022 by admissions.blog Leave a Comment

Yesterday afternoon, March 18, 2022, the University of Georgia released its final round of admissions decisions for first-year applicants to its Class of 2026. University of Georgia did require first-year applicants to submit test scores this admissions cycle, which makes the university’s average SAT and ACT ranges particularly impressive. Interestingly, University of South Carolina to the north remains test optional heading into the 2023 admissions cycle, while University of Florida and Florida State to the south remain test-required like UGA.

Overall forty-two percent of applicants were accepted (no in-sate vs. out-of-state acceptance rate breakdown was shared, though the university did take the time to report that fifteen students accepted had the first name of Georgia; last year roughly 15% of UGA’s first-year class came from outside of Georgia), nearly eight percent waitlisted, and forty percent denied. Roughly ten percent of applications were left incomplete or cancelled.

UGA’s New Admitted Student Profile (mid 50% range):

GPA: 4.00-4.30

SAT: 1330-1480

ACT: 31-34

AP/IB/Dual Enrollment course total mid-range/avg: 7-12, avg 10

A Primer for College Admissions Decisions

Posted on March 2, 2022 by Patrick O'Connor 2 Comments

We’re about three weeks away from the height of the release of college admissions decisions, the time of year when students pull their hair out either waiting to hear or musing over what they’ve heard.  Along with trying to ease student angst, college admissions veterans know they can expect an inbox full of articles featuring the following content:

  • Record High Applications at Highly Selective Schools
  • Highly Selective Schools Report New Lows in Admit Rates (yes, these two are related, but most Americans don’t understand this, thanks to the way we teach math in this country, so…)
  • Calls for Equity in Admissions Follow Record Application Year

We can expect these articles because they are written every year, partly to make an official record of what actually has happened, partly to supply some kind of solace to students who didn’t get the admissions news they had hoped (“See Son?  It was harder than ever to get in”) or to fatten the praise of those who did (“Wow!  I beat the odds in the Most. Competitive. Year. Ever!”)

To balance these “the sky is falling” articles, I write one that tries to keep everyone on an even keel, so they can provide some stability to the students and parents who are new at this, or who are doing it again, and forgot what it felt like the first time.  Hardly anyone notices the piece I write—it’s apparently more fun to be out there on rocky seas than to be safe in the harbor—but in the interest of trying to offer some support, here we go:

  • Not all applications are created equal. A college that reports a 5 percent admission rate doesn’t mean a particular student’s odds of getting in are 5 percent; it means the college admits 5 out of every 100 applications it receives.  Put another way, a student with a C average applying to Swarthmore doesn’t have the same “chance” of being admitted as a student with a 3.9.  Juniors should keep this in mind.
  • Much of the college experience depends far more on what the student puts into the experience than where they experience it. A former student was admitted to a Seven Sisters college, which then proceeded to gap her in financial aid.  She ended up at a public university, where she basically ran the Global Studies program where she earned a degree.  This included fulfilling her desire to do a semester abroad in South Africa, even though her college didn’t offer study abroad there.  She simply registered as a guest student at another college that did.  Tell me she would have had any of those opportunities at the Seven Sisters school.  Go ahead.
  • Notions of the need for change in the college admission process are overblown. It takes about 20 minutes to apply to most colleges, since they require neither essays nor teacher letters.  Since that’s about the same amount of time it takes to get to another level in Mario Brothers 812, it’s pretty safe to say most students can complete this task without life-altering stress.
  • Notions of change in the college admission process are simplistic, Part I. Admissions observers had a field day when COVID drove many competitive colleges to go test optional, a change that was gaining steam even before 2019.  Two years later, we now find a rise in “test optional strategies” from test prep advisors who will advise students on which tests to take, and which scores to send—all for a fee.  Similarly, we see some competitive colleges admitting fewer—far fewer—test optional students than those who submit scores, but deciding not to report that to the major public, since the “test optional” moniker is so highly valued.  The result?  A change that was supposed to make applying to college easier has made it harder in many cases, except at colleges where the admit rates were generous to begin with—and those are the schools where applying takes 20 minutes, and application reform wasn’t necessary.
  • Notions of change in the college admissions process are simplistic, Part II. Undeterred by the lack of real parity brought by many test optional policies, many reform advocates are now turning to essays and teacher letters of recommendation as the next parts to go in the current process.  This leads to two questions:
    • If you take out all parts of the current application process (some are even saying grades shouldn’t have to be reported), what do you replace them with?
    • Do you honestly think whatever you answered in the last question can’t also be gamed to favor the rich? Interviews?  Community Service?  Cake Baking?  Put any life experience or skill in the mix of college applications, and in a year, a horde of tutors will crop up that will give an edge to students who can afford their services.  That will be very hard to beat.
  • My annual plea for more counselor training in college counseling. If it’s safe to conclude that any admissions process will favor students who understand it, it’s reasonable to conclude it will favor any student who works with a counselor who understands it.  So, instead of changing the admissions process, how about leveling the playing field by making sure all counselors receive deep training in college counseling?  Less than 5 percent of all school counselor training programs devote any time to instruction in college counseling, and that sometimes only consists of how to register for the SAT.  Private school college counselors have greater access to professional development that keeps their already keen college counseling skills sharp.  Most public school counselors got their counselor training in a program that gave them no college counseling skills at all.  Which group needs to be better trained in the first place?

That should be all you need to make it through the media madness of the next month.  Release the hounds.


Notre Dame Accepts Only 17% Early Action As Record Number Apply

Posted on December 17, 2021 by admissions.blog 1 Comment

University of Notre Dame saw the number of students who applied via its Restrictive Early Action (REA) plan skyrocket this fall. A record 9,683 students applied to Notre Dame Restrictive Early Action in 2021. In 2020 7,744 students applied to Notre Dame Restrictive Early Action. That represents an over 25% increase in just one year.  Those applying to Notre Dame Restrictive Early Action have until May 1 to deposit and were able to apply to other colleges with Early Action programs but they were not allowed to apply concurrently via other colleges’ binding Early Decisions plans.

Yet, despite far larger numbers of REA applications to review, Notre Dame only accepted two more students REA in 2021 than it did in 2020; Notre Dame accepted 1,673 REA applicants in 2020 versus 1,675 REA applicants in 2021. This means that Notre Dame’s Restrictive Early Action acceptance rate dropped from roughly 22% to 17% in just one year, which helps bolster Notre Dame’s place in the realm of hyper-selective U.S. universities.

Meanwhile, a full 30% of REA applicants were accepted without submitting scores from the ACT or SAT. This is a huge change from just two years ago when scores from either the ACT or SAT were required of all admitted applicants. A full 46% of REA applicants to Notre Dame in 2021 applied without submitting test scores.

Unusual among many other selective U.S. universities, Notre Dame also shared that of those students accepted Restrictive Early Action in 2021 there are roughly even numbers of Asians/Pacific Islanders (12%), International students (12%), and Black students (10%).

Notre Dame released REA admissions decisions on Thursday, December 16, 2021, at 6:42 p.m. Eastern Standard Time, in a nod to the university’s founding year of 1842. Of the admitted student pool, 1,204 high schools are represented, including 43% public, 40% Catholic, and 18% private. A full 26% of accepted students indicated intended majors in the College of Arts and Letters, 22% in the College of Engineering and School of Architecture, 24% in the Mendoza College of Business, and 28% in the College of Science.

Typically, Notre Dame admits between 1,600 and 1,800 in its REA pool and a larger number in its Regular Decision pool, which this year has an application deadline of January 1, 2022. Last year, 1,768 students who were deferred during the REA round eventually earned admission during the Regular Decisions admissions cycle. This year, 1,599 REA applicants were deferred.


Yale’s Early Action Acceptance Rate Rises As Fewer Apply

Posted on December 16, 2021 by admissions.blog Leave a Comment

What goes up must come down. Yale, which saw its largest ever Single-Choice Early Action applicant pool in 2020, experienced a noteworthy decline in Early Action apps this fall.

The New Haven, Connecticut Ivy received 7,288 Single-Choice Early Action applications during the Fall 2021 admissions cycle, which is down nine percent compared to last year when Yale had 7,939 apply using the university’s Single-Choice Early Action plan. The 651 fewer applications this year indicates that the fanfare surrounding Yale’s decision to go test-optional may be wearing off.

As a result, Yale’s EA acceptance rate increased slightly from 10.5% in 2020 to 11% in 2021.

Meanwhile, this year (2021) 31% of students who applied through early action were deferred for reconsideration in the spring, 57% were denied admission, and 1% of applications were withdrawn or incomplete. Last year (2020) 50% of students who applied through early action were deferred for reconsideration in the spring, 38% were denied admission, and 1% of applications were withdrawn or incomplete.

Newly minted accepted Yale students have until May 2, 2022 to reply to their offer of admission. Traditionally, the vast majority of those accepted go on to matriculate.

  • « Previous Page
  • 1
  • 2
  • 3
  • 4
  • 5
  • …
  • 8
  • Next Page »

Subscribe to our mailing list

Trending Posts

First Impressions of Digital SAT

UNC Chapel Hill Releases 2023-2024 Supplemental Essay Prompts

10 Best Colleges for Smart Skiers and Snowboarders in North America

Battle of the Tech Titans: Caltech vs. MIT

Brown’s Regular Decision Acceptance Rate Now 3.8%

Tulane’s acceptance rate is 13%. Only 34% are male.

Penn unveils new supplemental essay prompts for 2023-2024 admissions cycle

Wake Forest Introduces Exclusive Early Action (EEA)

2023-2024 Common App essay prompts: the best and worst

Stanford University 2023-2024 Supplemental Essay Prompts Released

USC First-Year Applications Up 17%

Many high school counselors mean well but…

Boston University’s Overall Acceptance Rate Drops to 10.7%

Another Reason Why Your Common Application Essay is So Bad

UMass Amherst receives record 30,000+ Early Action applications

Building Your Best College List

Avoid Tuition Anxiety: Put Strong Merit Aid Colleges on Your List

Wesleyan University Ends Legacy Preferences in Admissions

New University of Virginia Supplemental Essay Question for 2023-2024 Admissions Cycle

Common Application Essay Prompts for 2023-2024 Confirmed

Northwestern Releases Regular Decisions, Class of 2027 Statistics

Rolling Admission vs. Regular Decision

30 Summer STEM Camps for High School Freshmen

Wesleyan University Ends Legacy Preferences in Admissions

12 Reasons Scattergrams Lull Students Into a False Sense of Security

UNC and a tale of one – make that four – acceptance rates

Making the most of the summer before senior year

You CAN apply Restrictive Early Action and Early Action under the right conditions

The Perfect Gifts to Celebrate Getting Into College

Search Posts By Topic

  • 3 Year Degree (3)
  • Accommodations (2)
  • Admissions Policies (108)
  • Admissions Statistics (74)
  • Advice & Analysis (367)
  • Alabama (2)
  • Amherst (2)
  • AP (5)
  • Applications (80)
  • Applying from India (1)
  • Arizona (4)
  • ASU (1)
  • Austin College (1)
  • Baylor (1)
  • Berry College (1)
  • Boston University (3)
  • Bowdoin (1)
  • Brown (6)
  • Bryn Mawr (1)
  • Business (1)
  • BYU (1)
  • Caltech (3)
  • Canada (2)
  • Career and Technical Education (25)
  • Case Western (4)
  • China (1)
  • CMC (1)
  • Coalition (13)
  • Colby (3)
  • College Counselor (17)
  • College Fairs (5)
  • College Life (34)
  • College List (36)
  • College List Deathmatch (5)
  • College Visit (24)
  • Colorado School of Mines (1)
  • Columbia (7)
  • Common Application (37)
  • Community Colleges (4)
  • Cornell (4)
  • COVID-19 (8)
  • CSS PROFILE (1)
  • CSU (1)
  • CU Boulder (2)
  • Cybersecurity (1)
  • Dartmouth (5)
  • Davidson (1)
  • Demonstrated Interest (17)
  • DePaul (1)
  • Dickinson (1)
  • Direct Admissions (1)
  • Duke (2)
  • Early Action (36)
  • Early Decision (39)
  • Educational Consulting (1)
  • Emory (1)
  • Engineering (1)
  • Enrichment (13)
  • Environmental Science (1)
  • Essays (47)
  • Europe (6)
  • Exercise Science (1)
  • Exeter (1)
  • Extracurricular Activities (27)
  • FAFSA (1)
  • Feature (2)
  • Financial Aid (24)
  • First Person (9)
  • Fly-In (1)
  • France (1)
  • FSU (1)
  • Gap Programs (2)
  • GED (1)
  • Georgetown (4)
  • Germany (2)
  • Gifts (3)
  • GPA (4)
  • Graduate School (3)
  • Hamilton (1)
  • Harvard (7)
  • Healthcare (1)
  • High School (22)
  • Higher National Diplomas (1)
  • HiSET (1)
  • IB (4)
  • IEC (1)
  • IELTS (1)
  • Indiana (3)
  • International (9)
  • Internships (7)
  • Interviews (10)
  • Iowa (2)
  • Italy (2)
  • Ivy League (20)
  • JHU (3)
  • Kettering University (1)
  • Lafayette (1)
  • Law (1)
  • LD (1)
  • Lists & Rankings (3)
  • Loans (1)
  • Majors (16)
  • Marketing (1)
  • Math (1)
  • Medicine (1)
  • Middlebury (1)
  • MIT (6)
  • Montana State University (1)
  • Naviance (2)
  • NCAA (3)
  • New Mexico State University (1)
  • News (92)
  • Northwestern (5)
  • Notification News (3)
  • Notre Dame (3)
  • Nursing (6)
  • NYU (3)
  • Of Note (5)
  • Ohio State (2)
  • Oklahoma (1)
  • Online Learning (3)
  • Open Admission (2)
  • Parents (7)
  • Penn (8)
  • Pharmacy (1)
  • Pitt (2)
  • Popular Posts (10)
  • Princeton (5)
  • Priority (2)
  • Professor of the Month (1)
  • PSU (3)
  • Public Universities (8)
  • Purdue (1)
  • Rankings (8)
  • Reader Questions (11)
  • Recommendations (8)
  • Regular (23)
  • Research (4)
  • Resume (18)
  • Rice (4)
  • Robotics (1)
  • Rochester (1)
  • ROI (3)
  • Rolling (5)
  • Rose-Hulman Institute of Technology (1)
  • Santa Clara University (2)
  • Scholarships (1)
  • Sewanee (1)
  • Skiing & Snowboarding (1)
  • SMU (1)
  • Social Work (3)
  • South America (2)
  • Southwestern (TX) (1)
  • Spotlight Series (1)
  • St. Edward's University (1)
  • St. John's College (1)
  • Standardized Tests (33)
  • Stanford (4)
  • STEM (1)
  • Stevens Institute of Technology (1)
  • Summer (17)
  • Swarthmore (1)
  • TASC (1)
  • Teacher Recommendations (7)
  • Temple (1)
  • Texas (3)
  • Texas A&M (1)
  • Ticker (23)
  • Trending Posts (46)
  • Trinity University (TX) (1)
  • Tufts (3)
  • Tuition (3)
  • Tulane (5)
  • UBC (1)
  • UC Berkeley (7)
  • UC Davis (1)
  • UC Santa Barbara (1)
  • UCAS (4)
  • UCLA (7)
  • UDub (1)
  • UF (3)
  • UGA (3)
  • UIUC (3)
  • UMass (2)
  • UMD (5)
  • UNC (2)
  • United Kingdom (6)
  • Universal College Application (1)
  • University of Chicago (2)
  • University of Dallas (1)
  • University of New Mexico (1)
  • University of Rochester (1)
  • University of Vermont (1)
  • USC (3)
  • UT Austin (1)
  • Utah (2)
  • UVA (7)
  • Vanderbilt (2)
  • Video Game Design (1)
  • Villanova (2)
  • Virtual Visit (1)
  • Wake Forest (1)
  • Wash U (7)
  • Wesleyan (1)
  • Williams (3)
  • Wisconsin (2)
  • Yale (12)
  • ZeeMee (1)

News Tips | Write for Us | Sponsored Posts
All content © 2023 | Admissions.Blog
Terms of Service | +1 410-526-2558

Copyright © 2023 · Metro Pro Theme on Genesis Framework · WordPress · Log in