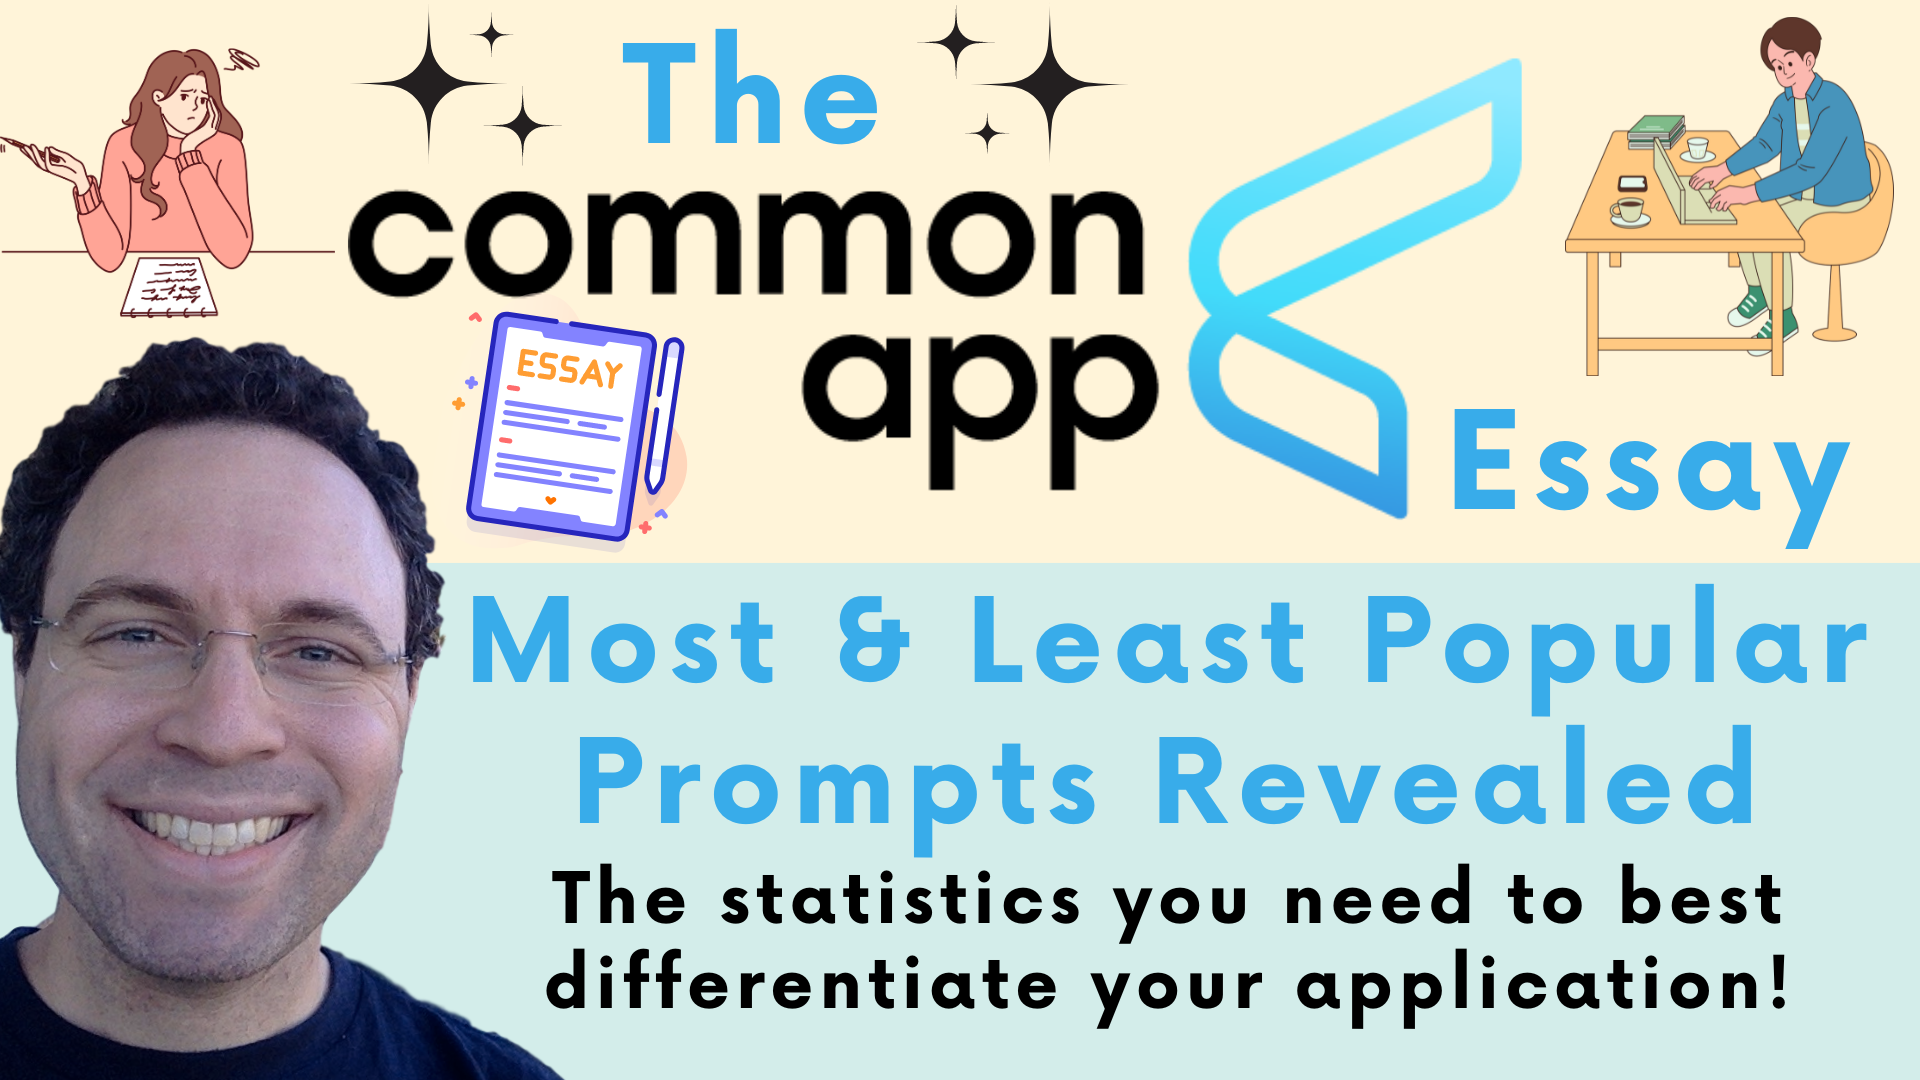
 Success in the college admissions process often comes down to one word: differentiation. Therefore, it makes a lot of sense to think long and hard about what Common App essay prompt you respond to in order to share the story you want to share in a manner that frames your experience in the most memorable and unique manner possible. In the video below you’ll learn which Common App essay prompts are most popular and least popular right down to the exact percentage of applicants responding to each prompt, which will help you determine the prompt you want to respond to when completing your Common Application essay.
To learn more about what I deem to be the best and worst Common App Essay prompts and why, watch my longer and more in-depth video here.
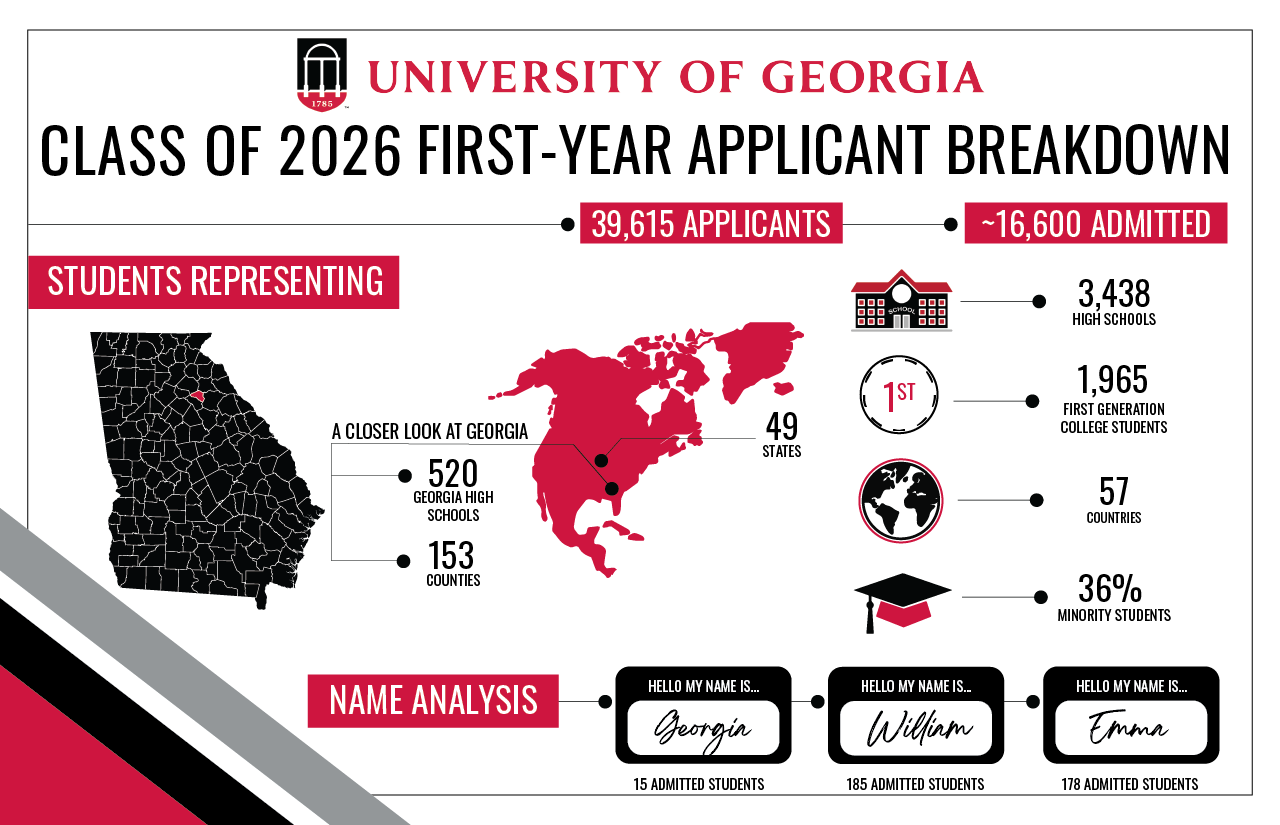 Yesterday afternoon, March 18, 2022, the University of Georgia released its final round of admissions decisions for first-year applicants to its Class of 2026. University of Georgia
 University of Notre Dame saw the number of students who applied via its Restrictive Early Action (REA) plan skyrocket this fall. A record 9,683 students applied to Notre Dame Restrictive Early Action in 2021. In 2020 7,744 students applied to Notre Dame Restrictive Early Action. That represents an over 25% increase in just one year. Those applying to Notre Dame Restrictive Early Action have until May 1 to deposit and were able to apply to other colleges with Early Action programs but they were not allowed to apply concurrently via other colleges’ binding Early Decisions plans.
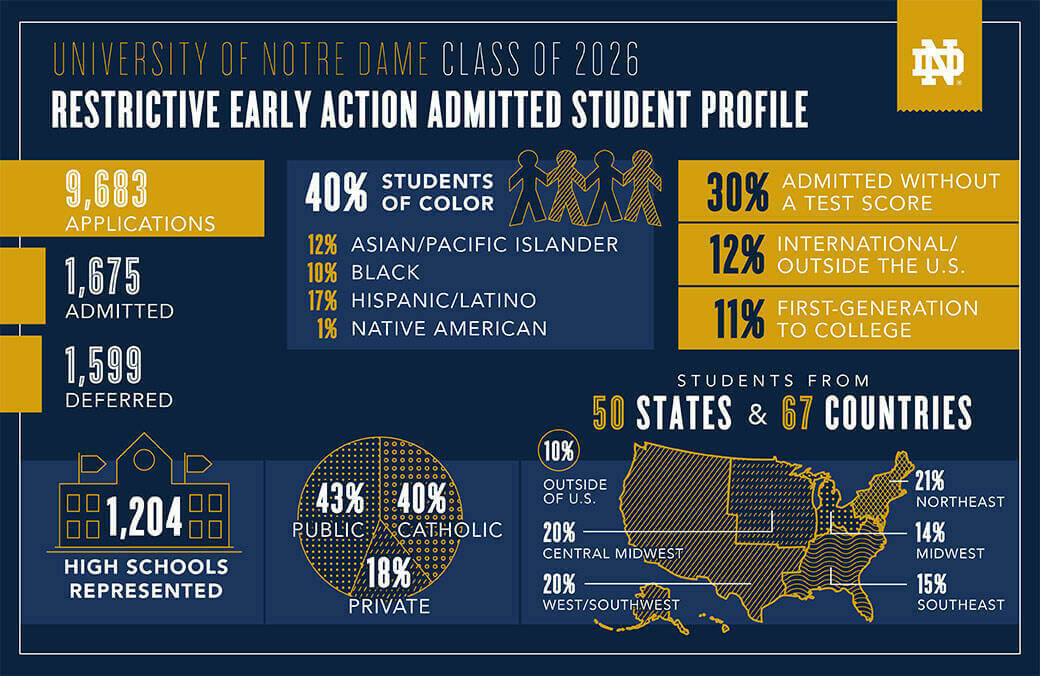
 What goes up must come down. Yale, which saw its largest ever Single-Choice Early Action applicant pool in 2020, experienced a noteworthy decline in Early Action apps this fall.
 Yale has shared news summarizing its 2020-2021 admissions cycle.