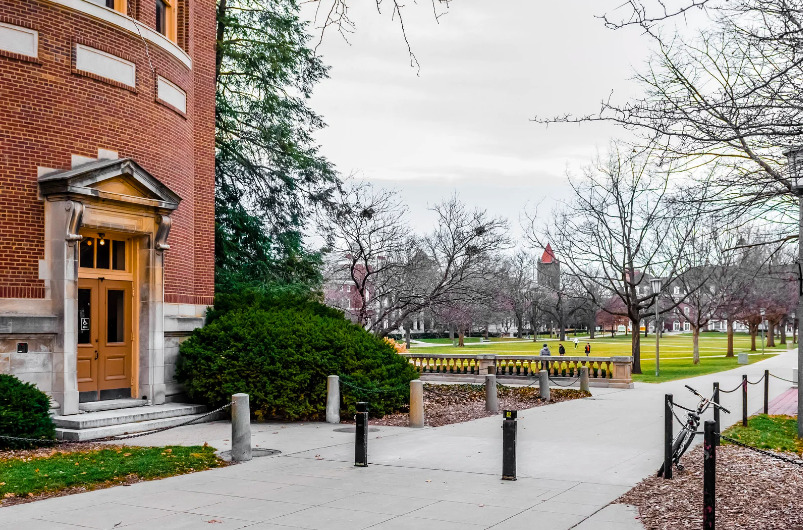
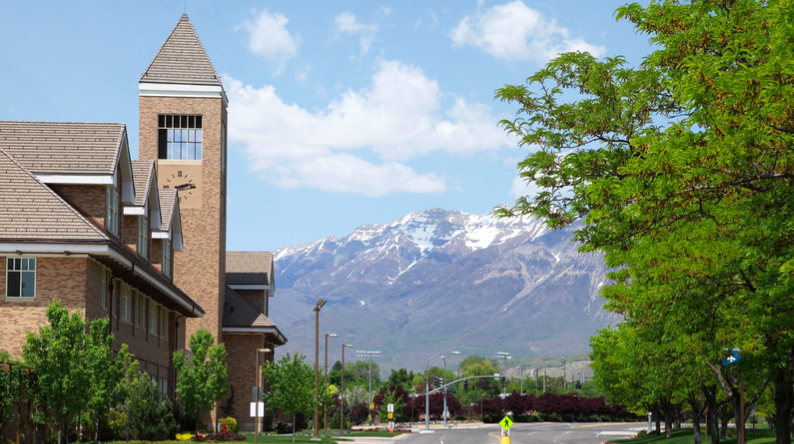
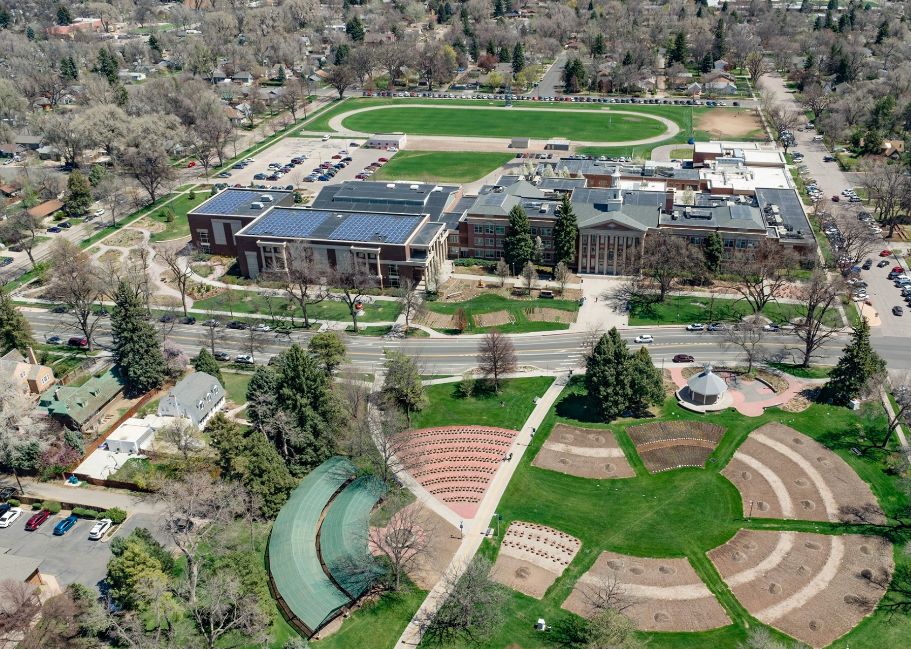
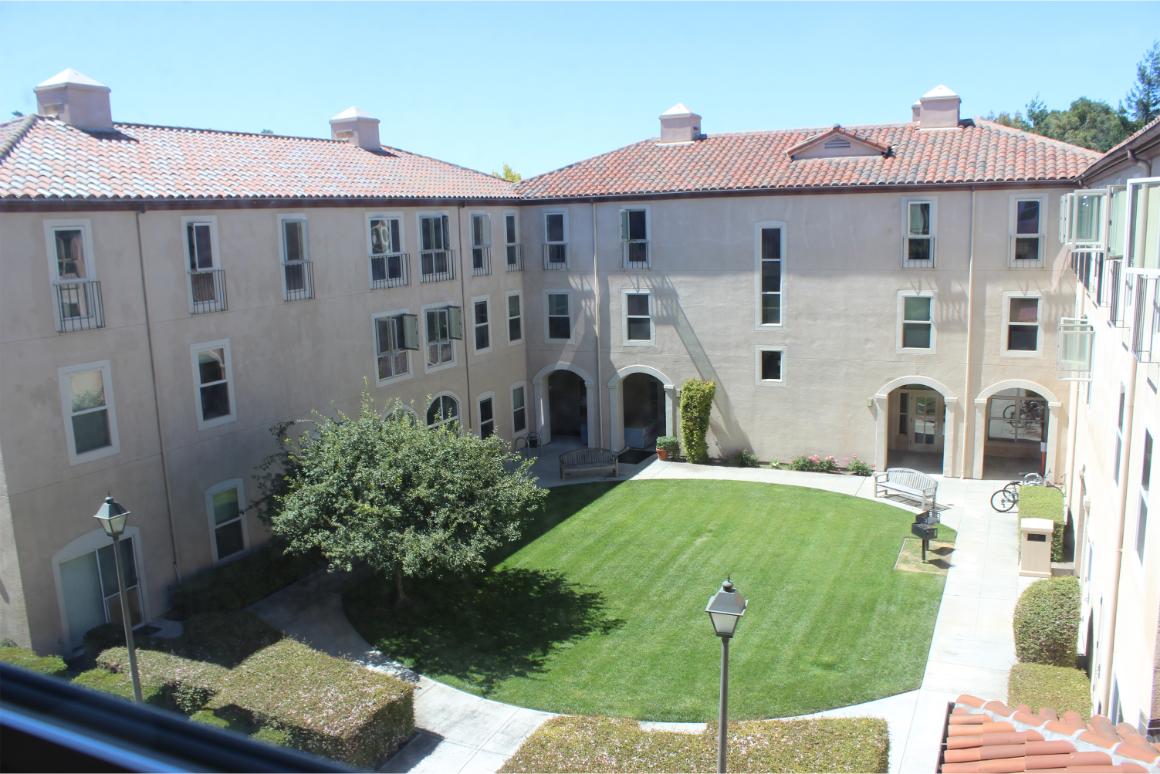
BYU’s Campus in Provo, Utah, USA.
Today’s reader question comes from Suzie in Topeka, Kansas:
Question: Brigham Young University seems great for me based on what I’ve read on its website. But a lot of my friends and even my high school counselor have urged me to not to consider it because of its faith-based culture. It seems like people either love BYU or hate it. What’s the deal with that?
Answer: The United States is a free country, which means a diversity of views on all topics is to be expected. Yet, even I find the very strongly held views about BYU to be startling. I think what you are experiencing comes down to those who view religion in general and The Church of Jesus Christ of Latter-day Saints in particular with suspicion versus those who are relatively “agnostic” towards attending a religiously-affiliated college and those who view it as a net positive. I encourage you – and all students – to dig deeper than by simply viewing BYU through the lens of religion.
First the basics: Brigham Young University (BYU) is a private research university located in Provo, Utah. It is owned and operated by The Church of Jesus Christ of Latter-day Saints, and as such, its educational philosophy is rooted in the values and principles of the LDS Church. As of Fall 2022, Brigham Young University’s main campus in Provo had an enrollment of approximately 31,389 undergraduate students. With 51% female and 49% male, 77% of students were single and 23% were married. The university has 195 undergraduate majors, 112 undergraduate minors, 98 master’s programs, and 30 doctoral programs. About 36% of students are from Utah, 12% from California, 6% from Arizona, 6% from Texas, 5% from Idaho, and 5% from Washington. In terms of student ethnicity, Caucasian make up 81%, Hispanics or Latinos make up 9%, two or more races make up 4.5%, Asians make up 3%, Pacific Islanders make up 1%, Blacks make up 1%, and American Indians less than 1% of the student population. There were 1,241 international students enrolled in Fall 2022, and they came from 102 countries total with the top three countries represented being Canada, Mexico, and South Korea.
Here are some reasons why BYU can be a great place to be an undergraduate student:
Strong Academics: BYU offers a wide range of undergraduate majors and programs, including highly regarded programs in business, engineering, and education. The university is consistently ranked among the top 100 national research universities in the United States by U.S. News & World Report.
Language Education: BYU has one of the largest and most comprehensive language programs in the United States. The university offers courses in over 70 languages, including less commonly taught languages such as Arabic, Chinese, and Russian. BYU also has a Language Training Mission, where students can receive intensive language instruction and practice in a simulated immersion environment.
Athletic Tradition: BYU has a strong athletic tradition, particularly in football and basketball. The university is a member of the West Coast Conference and has won numerous conference championships and national titles. BYU’s athletic programs are known for their emphasis on sportsmanship and moral values.
Quality Faculty: The faculty at BYU are highly accomplished and dedicated to teaching. Many professors have received national and international recognition for their research, and the student-faculty ratio is low, which allows for more personalized attention from professors.
Honor Code: The BYU Honor Code promotes a culture of integrity, respect, and accountability. Students are expected to live by certain standards of behavior and dress, and the university provides resources and support to help students meet these expectations.
Campus Culture: BYU’s campus culture is centered around the values of the LDS Church, including service, leadership, and faith. Students are encouraged to participate in service opportunities both on and off campus, and the university offers many programs and resources to help students strengthen their faith.
Campus Beauty: BYU’s campus is known for its beautiful and well-manicured grounds. The university has won numerous awards for its landscaping, including recognition from the Professional Grounds Management Society. The campus features numerous fountains, sculptures, and gardens, as well as stunning views of the nearby mountains.
Student Life: BYU has a vibrant student life, with numerous student organizations, clubs, and activities. Students can get involved in sports, music, theater, and other extracurricular activities, and there are many opportunities for socializing and making friends.
Location: Provo is a beautiful and safe city located at the base of the Wasatch Mountains. The area offers many opportunities for outdoor recreation, including hiking, skiing, and mountain biking. The city also has a thriving downtown area with many restaurants, shops, and cultural events.
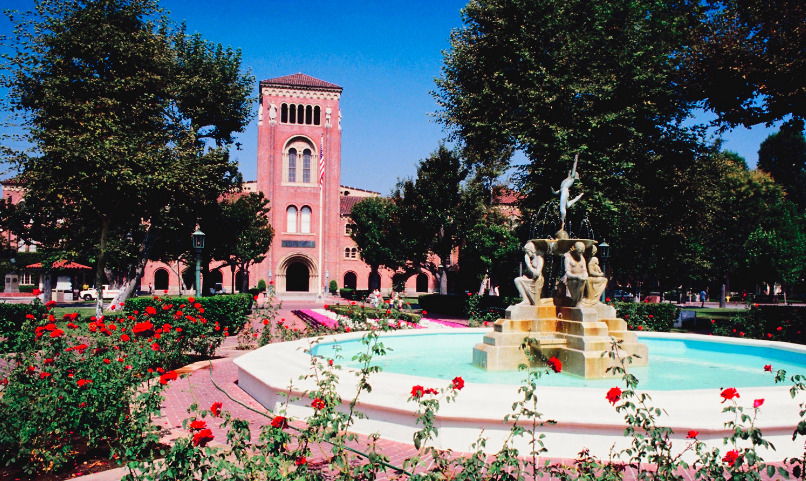
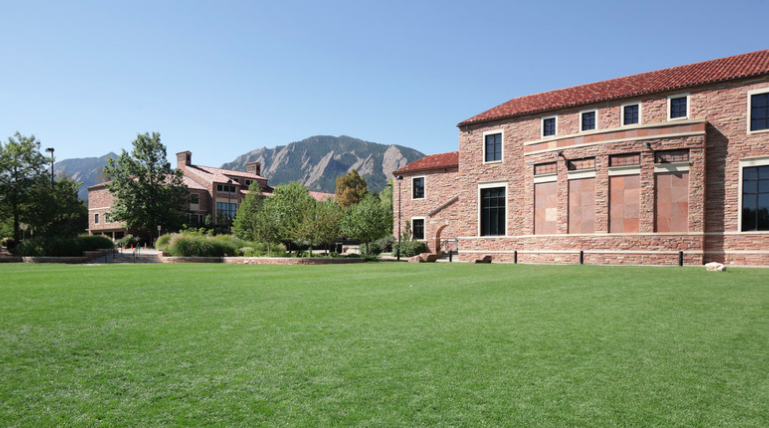
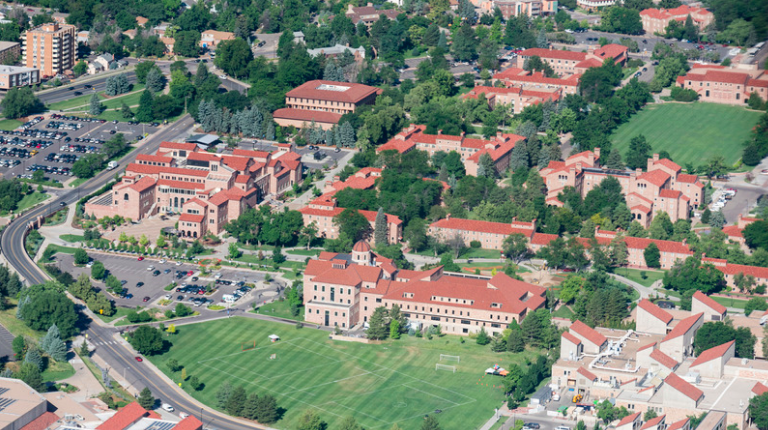
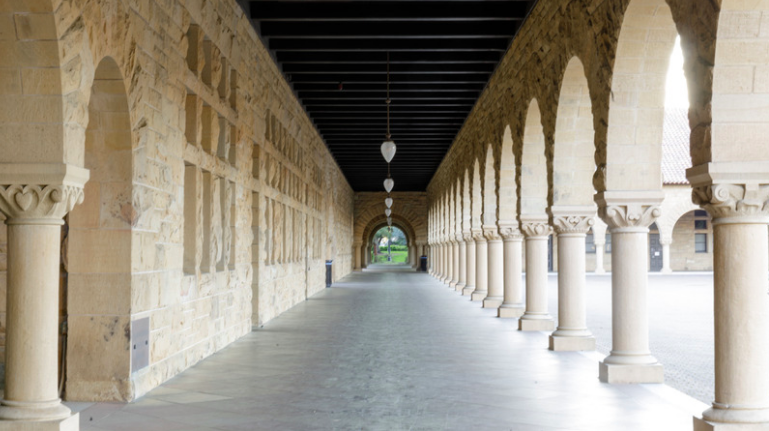
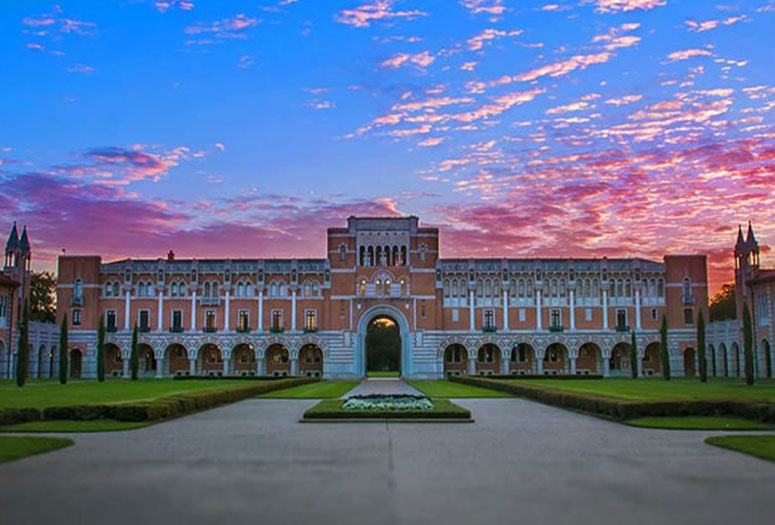
Another view of BYU’s campus.
Overall, I think Brigham Young University is a great place to be an undergraduate student for those who are interested in a strong academic program, a culture of integrity and respect, and opportunities for personal and spiritual growth. I am particularly fond of and think some of the highlights of BYU’s campus include:
BYU Museum of Art: The BYU Museum of Art is one of the largest and most impressive art museums in the Intermountain West. The museum features over 18,000 works of art from various cultures and time periods, including paintings, sculptures, and photographs. The museum also hosts numerous temporary exhibits and events throughout the year.
Harold B. Lee Library: The Harold B. Lee Library is one of the largest academic libraries in the United States, with over 7 million volumes in its collection. The library also features several unique and impressive spaces, including the Sunburst Atrium and the Special Collections Reading Room, which houses rare books and manuscripts.
BYU Broadcasting: BYU is home to a state-of-the-art broadcasting facility that includes several television and radio stations. BYU Broadcasting produces a wide variety of programming, including news, sports, and entertainment. The facility also offers students opportunities to gain hands-on experience in broadcasting and media production.
LaVell Edwards Stadium: LaVell Edwards Stadium is the home of BYU’s football team and is one of the largest stadiums in the state of Utah. The stadium seats over 63,000 fans and features a unique design that allows for excellent sight lines and acoustics. The stadium also includes several impressive amenities, including a state-of-the-art video board and luxury suites.
Though Brigham Young University (BYU) has many positive aspects, there are also some factors that may make it an unpleasant place to be an undergraduate student for certain individuals. Here are some possible drawbacks to attending BYU consider:
Strict Honor Code: While the Honor Code at BYU is designed to promote a culture of integrity and respect, some students may find it restrictive or burdensome. The Honor Code includes rules about dress, grooming, and behavior, and violations can result in disciplinary action, including suspension or expulsion.
Religious Requirements: Because BYU is owned and operated by The Church of Jesus Christ of Latter-day Saints, religion plays a significant role in the university’s culture and curriculum. All students are required to take religion classes, attend weekly devotionals, and uphold certain standards of behavior based on LDS Church teachings. Students who are not members of the LDS Church may feel uncomfortable or excluded in this environment.
Limited Diversity: BYU has a predominantly white, middle-class student population, and diversity in terms of race, ethnicity, and socioeconomic background can be limited. Some students may feel isolated or marginalized if they do not fit the dominant culture on campus.
Social Life Restrictions: BYU has strict rules about relations between students, which are inspired by LDS Church teaching. For instance, sexual relations outside of marriage are not condoned. Some students may find these restrictions frustrating or isolating, particularly if they are used to a more relaxed social environment.
Location: While Provo is a beautiful and safe city, it may not be the best fit for all students. The city is relatively small and may not offer as much cultural or entertainment options as larger cities. Additionally, the university’s location in Utah may not be desirable for students who prefer a more diverse or liberal environment.
Therefore, as you can probably tell by now, while Brigham Young University can be a positive and enriching experience for many students, it is important to consider the potential drawbacks before deciding if it is the right fit for you. I strongly recommend students visit any college before enrolling; therefore, make plans to see BYU for yourself if you are considering applying and/or attending.
A Bit More About Provo
Provo, Utah, is a vibrant and growing city with many positive aspects. However, like any place, it also has some drawbacks. Here are some of the best and worst aspects of living in Provo:
Best aspects:
Natural Beauty: Provo is located in the heart of Utah Valley, surrounded by the majestic Wasatch Mountains. The area is known for its natural beauty and offers a variety of outdoor recreational opportunities, including hiking, skiing, and fishing.
Community: Provo has a strong sense of community and is known for its friendly and welcoming residents. The city hosts numerous community events throughout the year, including festivals, concerts, and farmers markets.
Safety: Provo is one of the safest cities in Utah, with a low crime rate and a strong police presence.
Worst aspects:
Cost of Living: Provo’s cost of living is higher than the national average, particularly in terms of housing costs. The city’s growing population and limited housing supply have led to higher rent and home prices.
Conservative Culture: Provo has a relatively conservative culture compared to other parts of the U.S.A., which may not appeal to everyone. While many residents value the city’s religious and cultural traditions, others may feel out of place.
Limited Nightlife: Provo has a relatively limited nightlife scene, particularly compared to larger cities. There are fewer options for entertainment and socializing in the evenings, particularly for young adults.
Air Quality: Provo is located in a valley, which can lead to poor air quality, particularly during the winter months. The city has taken steps to address this issue, but some residents may still experience respiratory problems or other health issues as a result.
Overall, Provo, Utah, has many positive aspects, including its natural beauty, strong sense of community, and focus on education. However, the city’s higher cost of living, conservative culture, limited nightlife, and air quality issues may be drawbacks for some.
BYU Admissions
As of 2022, 11,709 students applied to become BYU freshmen, and of those, only 66.2% were accepted. To learn about the latest admissions statistics and requirements to apply as a first-year student to BYU, visit its admissions site here.
Crossover Colleges
Many students who are interested in applying to or attending BYU due to its location also consider and are attracted to University of Utah. Those interested in BYU for its conservative Christian character may also be interested in BYU’s other campuses, Liberty University or Bob Jones University.
 Boston University admissions officers are just about as busy this year as they were last year after receiving 80,484 applications during the 2022-2023 admissions cycle. During the 2021-2022 admissions cycle BU received a record-breaking 80,797 applications from prospective first-year students.

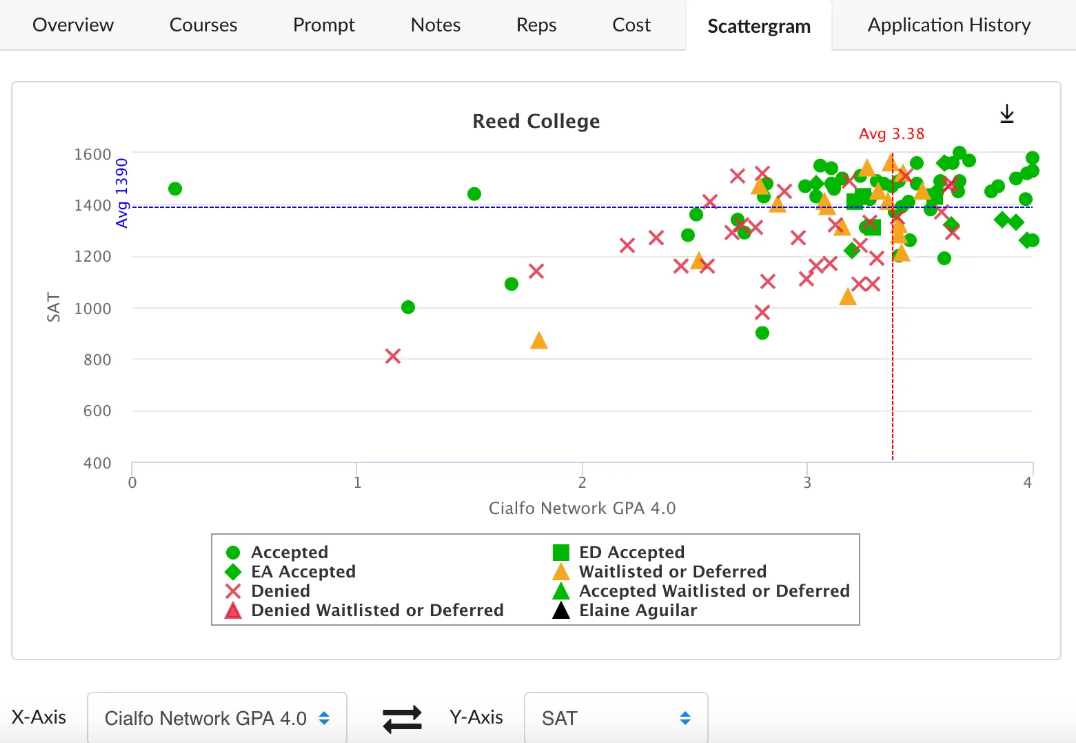 The typical student seeing the first of the two scattergrams above assumes, if he or she has a 3.6 GPA and an SAT score of 1860 he or she is definitely going to get into University of Maryland College Park. Most of the rest of students with that combination of grades and scores would assume, after seeing the above scattergram, that Maryland is at least a huge safety college for them. After all, all students from this high school in the past few years who land in that GPA/score range got into Maryland, as illustrated by all of those green squares.