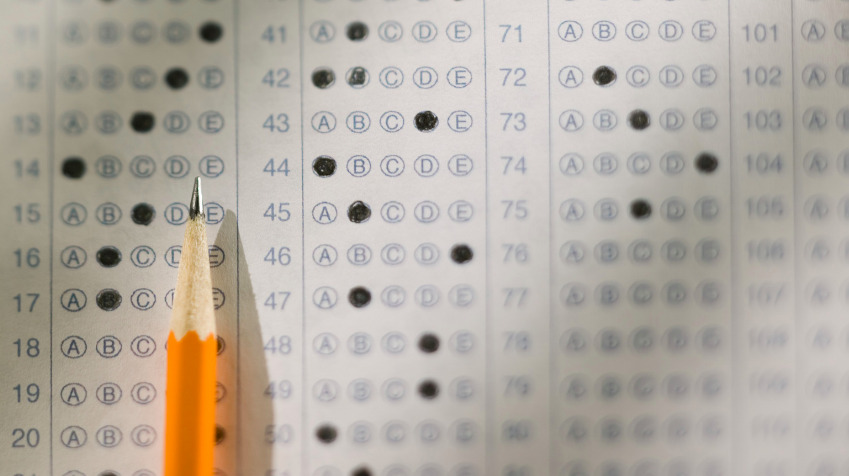
Many high schools don’t provide proactive college counseling to students until the end of eleventh grade. Don’t wait until your school gets around to it. Find out when to assertively approach your counselor.
What’s a CEEB High School Code and Why is it Important?
When registering for standardized tests and filling out college and university applications be ready to provide your high school’s CEEB code, which helps your counselor and admissions officers.
2017 Advanced Placement scores are now available
In case you missed the email, the College Board rolled out Advanced Placement (AP®) scores for tests taken this past May earlier this month. And by now, most AP students should have already received their scores—for better or worse!
For the record, old fashioned snail mail reports were discontinued several years ago in favor of an online arrangement that requires you to have a College Board account to access scores. In other words, to obtain scores, students must have
- an online College Board account requiring registration
- a username and password
- 2017 AP number (the number on the labels in the Student Pack) OR student identifier (student ID number) if provided on your answer sheet
Unless there was a problem with identification, scoring or test administration, your scores should now be available and will be added to a cumulative report of all AP tests you have taken to-date (you actually have to pay an extra fee to have any scores removed from the report).
If you’re unlucky enough not to have a score report, feel free to contact the College Board at [email protected] or 888-225-5427 (toll free) or 212-632-1780, especially if you haven’t received scores by September 1.
And what do the scores mean? AP scores are a “weighted combination” of results on the multiple-choice and free-response sections. The final score is reported on a 5-point scale, as follows:
- 5: Extremely well qualified to receive college credit or advanced placement
- 4: Well qualified
- 3: Qualified
- 2: Possibly qualified
- 1: No recommendation
You can also think of the five-point scale in terms of letter grades, with 5 equating to an “A” and 1—well, you get the picture.
And what are they worth? The awarding of credit and placement status is determined by individual colleges or universities. You can check directly with the school or on the College Board website to research this information, but note that the latter is neither as specific nor as accurate as what you are likely to find on individual school websites.
In most cases, a student who scores a 4 or 5 may receive college credit. In rare cases, a school will require a 5, and almost no colleges will accept a score of 2. In fact, the most selective colleges will not accept a 3 for credit.
For example, George Mason University will accept a score of 3 for 4 credits in an entry-level environmental science class. For 8 credits, the student must earn a 4 or 5 on the exam. Neither Georgetown nor GW will award credit for any score below a 4. In fact, Georgetown awards no credit for AP Capstone, AP Computer Science Principles, AP Comparative Government, AP US History, AP Human Geography, and AP Physics 1 or 2.
The University of Virginia generally awards credit for scores of 4 or 5, but for French will dip as low as a 3 for some entry-level exemption. The University of Maryland takes a different approach and awards credit for scores of 3 or better in Art History, English Language and English Literature but requires at least a 4 to receive credit in a foreign language.
Keep in mind that wise use of AP credit can reduce the total number of credit hours needed to graduate. At Virginia Tech, students are allowed to use up to 38 hours of AP credit towards graduation, while Vanderbilt University will only award up to 18 credits. And Dartmouth College will accept no AP credits toward graduation.
AP exam scores may also be used to meet standardized test requirements in the admissions processes of several colleges. Fair Test keeps track of this evolving trend on its Test Score Optional List and includes Colby College, Colorado College, Drexel University, Hamilton College, Middlebury College, NYU and the University of Rochester among those colleges and universities allowing APs to be submitted in place of ACT/SAT scores.
Teachers and AP administrators will also be receiving scores this month, and many high schools include score distributions in the school profiles they send to colleges along with transcripts (see Montgomery Blair High School’s profile for a good example). This is so admissions offices can put individual scores reported on applications in context with those earned by others in your class. But note that some high schools are extremely reluctant to make this information public and will routinely deny requests from families interested in evaluating a particular class or teacher.
For those new to the process, the online reporting system seems like an efficient, environmentally-friendly way to get scores. But be aware. The College Board can now connect your AP scores with PSAT and SAT scores as well as any grade, career interest or family income information you provide in the course of test registration or on their net price calculators.
And the College Board is all about mining for data that can be sold to postsecondary institutions, scholarship programs, or any number of organizations willing to pay for lists it aggressively markets.
These connections can be both good and bad. If you haven’t graduated from high school, expect to receive recruitment materials from colleges purchasing name and contact information anxious to get to know you. At the same time, don’t be surprised to hear from questionable honor societies or other organizations hoping to con you into paying for something you don’t want.
Check back tomorrow for a sneak preview of AP test results as tweeted by College Board executive, Trevor Packer.
Save
National Merit® ‘Commended Student’ cutoff up by 2 points
The National Merit® Scholarship Corporation (NMSC) has confirmed that the national cutoff score for the ‘Commended Student’ designation will be 211 for the class of 2018—or 2 points higher than the cutoff for the class of 2017. While the higher cut score isn’t particularly predictive of state-by-state ‘Semifinalist’ cutoffs (except possibly at the lowest levels), it does reinforce speculation that continued upward pressure on PSAT/NMSQT® scores may result in higher score requirements for students hoping to earn National Merit Scholarships in some states.
“A simple response to a 2-point increase in the Commended Student cutoff would be to assume a 2-point increase in state Semifinalist cutoffs. It turns out that things are far from simple,” writes Art Sawyer in the Compass Education Group blog. “Based on our research, we are predicting that the most common state cutoff changes will be +0, +1, and +2. We expect that a small number of cutoffs may drop a point or go up by 3 points.”
And between changes in test scoring eliminating the guessing penalty and changes in the scale (from 20-80 to 160-760), the use of data from years prior to 2016 make estimates for state-by-state cutoffs a little complicated.
In addition, the scoring changes together with a new computation for the PSAT/NMSQT “Selection Index” (math, writing/language and reading on a scale of 8 to 38 multiplied by two) also put into play the possibility that two students from the same state with identical Total PSAT/NMSQT scores from the October test could have very different outcomes—one commended (or semifinalist) and one not.
According to the NMSC website, of 1.6 million NMS entrants, roughly 50,000 with the highest Selection Index (SI) scores qualify for recognition in the scholarship program. Note that only students taking the PSAT/NMSQT in the 11th grade qualify.
About 34,000 or more than two-thirds of the high scoring juniors receive Letters of Commendation. These students are named on the basis of a “nationally applied” SI score which varies from year-to-year and is typically below the level required for participants to be named semifinalists in most states. For the class of 2017, the cutoff score was 209. In 2016, the last year to use the “old” PSAT, the cutoff score was 202. In 2015, it was 201 and in 2014, it was 203.
The increase in this year’s cutoff for commended status is in line with generally inflated PSAT scores, which may have been encouraging to students initially hoping to qualify for a National Merit Scholarship. Unfortunately, life isn’t always so straightforward and the NMS competition is anything but straightforward. State-by-state semifinalist cutoffs are predictable within a range. But only after the NMSC applies a little politics to its formula and the announcement is made in September will there be any certainty as to who qualifies as a semifinalist. To earn the title of “finalist,” these students will have to jump through an additional series of largely bureaucratic administrative hoops.
To facilitate the conversation about the class of 2018, however, Compass Education Group has come up with a chart predicting “estimated ranges” (with 1330 comments) for the state-by-state semifinalist cutoff. The ranges “reflect the variability of year-to-year changes within a state” and are based on research conducted by the test wizards at Compass Prep. While interesting, the ranges and “most likely” scores are by no means guaranteed.
At this point, it’s not worth spending a whole lot of time worrying about PSAT/NMSQT® results. They are predictive of very little beyond possible achievement on the SAT. Colleges will never see these scores, and how the NMSC determines state-by-state semifinalist cutoffs is entirely out of anyone’s control.
James Madison University goes ‘test-optional’ for 2017-2018
Joining a growing number of colleges and universities, James Madison University (JMU) will be rolling out a test-optional admissions policy for 2017-18. Students seeking admission will no longer be required to submit tests results from either the SAT or the ACT as part of the JMU application process.
Unlike other Commonwealth universities, which have also decided to downgrade reliance on standardized tests in admissions, JMU will not be adding any “strings” to their new policy. There will be no minimum GPAs, similar to test-optional policies in use by Christopher Newport University, George Mason University or Virginia Commonwealth University. Applicants will be entirely free to decide whether they want to include test scores along with their applications.
“We’re providing applicants to Madison the opportunity to build their best application which could include test results, recommendation, or personal statement,” explained Joe Manning, JMU’s Associate Dean of Admission. “We’ve determined that our students’ high school curriculum is a more consistent indicator of their academic success.”
The new policy didn’t come as a huge surprise to counselors who have worked with Madison over the years. It’s been evident by their decisions that application readers placed significant importance on information conveyed via the transcript—grades and consistent rigor of coursework throughout high school. Test results, while considered, appeared to be of secondary importance in Madison’s admissions decisions.
And JMU is joining an impressive group of colleges and universities that have made the decision to reduce the role of scores in admissions. According to the nonprofit National Center for Fair and Open Testing (FairTest), the list of test-optional schools has grown to more than 950 accredited institutions awarding bachelor’s degrees, with more than 275 highly “ranked” in their “tiers” by U.S. News, including such familiar names as Bowdoin, Mount Holyoke, Pitzer, Smith, Trinity College, Wesleyan, Wake Forest, Providence and College of the Holy Cross.
In addition to James Madison, the most recent schools to announce test-optional policies are Emerson College in Boston, University of the Ozarks and Wofford College in South Carolina. In the DC/Maryland/Virginia region, American, Catholic, Christopher Newport, GMU, George Washington, Goucher, Hampton, Hood, Loyola Maryland, Marymount, Old Dominion, Radford, Roanoke, Salisbury, St. John’s College, Trinity Washington University, Mary Washington, VCU and Washington College have either test-flexible or test-optional policies in place.
There appear to be a number of reasons for the recent “surge” in test-optional colleges. According to Robert Schaeffer, public education director for FairTest, “Admissions offices increasingly recognize that they do not need ACT or SAT scores to make good decisions. They know that an applicant’s high school record—grades and course rigor—predicts undergraduate success better than any standardized exam.”
Register NOW: Test sites are in short supply for August SAT
When the College Board first announced the addition of an August test date for the SAT beginning this summer, cheers went up among those who had lobbied for adjusting the test schedule to accommodate the reality of earlier application deadlines. ACT added a September test several years ago, which turned out to be enormously popular among students with time to prep over the summer who wanted one last try before going the early admissions route. And the College Board finally saw the wisdom of doing the same.
But enthusiasm for the August test date wasn’t universally shared, particularly among test site administrators in school districts starting late in August or after Labor Day. They could easily see how difficult it would be to open buildings and find staff willing to end summer vacations early to proctor one more test.
And it appears they were right. A quick comparison of test site availability for the August 26 SAT as compared with the October 7 SAT shows that so far the College Board has come up a little short in finding seats for the test.
For example, the College Board ordinarily offers up to about 40 sites that are considered a reasonable distance (under 40 miles) from my Virginia zip code. For August, there are only 12 locations, and they do not include the high schools closest to my home which have been popular sites in the past. Instead of traveling 3.6 miles to take the test, my nearest site is about double the distance away–admittedly not too much of a hardship as long as seats remain open. But I certainly would not want to have to travel to some of the further locations suggested by the College Board, which would take me 35 miles from home and across the Washington Beltway!
Using information provided by the College Board, it appears that about 1,970 sites in the U.S. (including D.C., Puerto Rico and the Virgin Islands) will be administering the SAT and SAT Subject tests on August 26. On October 7, however, almost 3,440 sites will be giving the test.
In Virginia, there will be 134 test locations for October and 84 in August. Pennsylvania will open 231 sites in October, but only 87 in August. In New York, it’s 263 locations for October, and 53 in August. Massachusetts has 140 test sites in October and 37 in August. And in New Jersey, students will have 203 locations from which to choose in October, but only 69 in August.
Note that the number of available test sites offered doesn’t necessarily correlate with or predict the number of seats available. In this area, it appears that the larger sites will be open for business in August, while some of the smaller sites have opted out.
The August date is also replacing the relatively unpopular January test, which will no longer be given. And it’s possible that sites simply don’t want to add another working Saturday to their calendars.
But given the convenience of the new August test relative to making decisions about application strategies—binding Early Decision vs. nonbinding Early Action vs. Regular Decision–and ensuring timely delivery of scores, it seems entirely possible that the new date could be very popular–possibly more popular than October.
“We’re seeing a great degree of interest for the August test in all of our markets, coast to coast. Students have so many academic demands as juniors. APs wrap in May, then final exams, and then the early application deadlines hit in Mid-October to November. August stands out as an excellent time to take an SAT, fully prepared, with minimal academic distractions,” explained Jed Applerouth, founder and CEO of Applerouth Tutoring. “I’m personally a huge fan of summer testing. Ideally students will be able to take these college assessments entirely on their own schedule. The summer, not surprisingly, is one of the most spacious times for many students, affording them the time to focus, prepare, and go in with the greatest chance of success.”
In other words, if I lived in Massachusetts, New Jersey, New York, Pennsylvania or Virginia, I would be registering NOW and not later!
ACT is countering with a summer test of their own. In 2018, the ACT will be adding a July test date to the standardized test calendar.
Top schools continue to see more ACT scores
Despite whatever feelings he has about the ACT, Georgetown’s admissions dean Charles Deacon concedes that the highly-selective university saw an increased number of students taking and submitting ACT scores this year. According to The Hoya, Georgetown’s student-run newspaper, the number of students submitting ACT scores was about even with those submitting SAT scores among this fall’s early applicants.
And this is a relatively new phenomenon.
For more than a half century, the ACT ran a distant second to the SAT in the high-stakes college admissions race. It was the “We Try Harder,” entrance exam—popular in the Midwest and the South but hardly worthy of notice on either coast.
But that all changed several years ago, as the ACT pulled ahead of the SAT in terms of test-taking popularity. And since then, the ACT has continued to widen the gap.
It’s not that the College Board is hurting for customers. In fact, more test-takers completed the new SAT from March through June of 2016 than took the old SAT during the same period in 2015, according to a report published by the College Board last fall.
But the number of high school graduates taking the ACT soared to a record 2.1 million students—nearly 64 percent of graduating seniors. From 2012-2016, the number of ACT test-taking high school grads increased by 25.5 percent, while the estimated overall number of graduates has increased by only 1.3 percent, leaving the College Board with something serious to think about.
In all fairness, a significant percent of the growth experienced by the ACT is a direct result of the adoption of the ACT for statewide assessment. For the graduating class of 2016, the ACT was administered to all public school graduates in 20 states. These students were pretty much required to take the ACT—like it or not.
But the good news for the ACT doesn’t end there. Not surprisingly, the number of tests submitted for admissions purposes shows a similar trend. Colleges are definitely seeing way more ACT scores than they did a decade ago. And it appears that many more students are taking both tests and submitting both sets of scores for consideration by colleges, particularly uber-selective institutions.
According to the New York Times, there appears to be a real “shift in the behavior of top high school students,” as many more choose to work toward high scores on both tests. And that’s okay with top colleges.
“I don’t know all the pieces of why this is happening, but I think more students are trying to make sure they’ve done everything they can,” said Janet Rapelye, dean of admissions at Princeton University, in an interview with the Times. “And for us, more information is always better. If students choose one or the other, that’s fine, because both tests have value. But if they submit both, that generally gives us a little more information.”
And applicants are getting the message. Those with top scores on both tests want colleges to have the benefit of knowing they did well on both. On the flipside, those who did significantly better on one test or the other tend to only submit the better set of scores—depending on the specific rules of the particular college or university.
It will be interesting to see how this trend evolves as “new” or redesigned SAT test results make their appearance among this year’s admissions decisions, particularly as the SAT has transformed itself into yet another curriculum-based test and blurred its differences with the ACT.
Regardless, based on test-submission patterns easily tracked for colleges posting Common Data Set information, the College Board has a very real challenge making up for ground lost to the ACT.
Here is a sample of test-submission statistics for the freshman class entering in 2005 as compared to the classes entering in fall 2016 (note that yearly totals exceeding 100% indicate colleges considered both the SAT and the ACT for some students):
Amherst College
2005 SAT: 87% vs. 2005 ACT: 13%
2016 SAT: 52% (53% in 2015)vs. 2016 ACT: 51% (49% in 2015)
Auburn University
2005 SAT: 31% vs. 2005 ACT: 69%
2016 SAT: 12% (14%) vs. 2016 ACT: 87% (85%)
Carnegie Mellon University
2005 SAT: 98% vs. 2005 ACT: 17%
2016 SAT: 78% (84%) vs. 2015 ACT: 41% (37%)
Case Western Reserve
2005 SAT: 89% vs. 2005 ACT: 58%
2016 SAT: 50% (57%) vs. 2016 ACT: 66% (62%)
College of William and Mary
2005 SAT: 97% vs. 2005 ACT: 3%
2016 SAT: 77% (80%) vs. 2016 ACT: 44% (44%)
Cornell University
2005 SAT: 98% vs. 2005 ACT: 18%
2016 SAT: 69% (75%) vs. 2016 ACT: 51% (45%)
Dartmouth University
2005 SAT: 89% vs. 2005 ACT: 11%
2016 SAT: 53% (59%) vs. 2016 ACT: 47% (41%)
Georgetown University*
2005 SAT: 95% vs. 2005 ACT: 7%
2015 SAT: 78% (84% in 2014)vs. 2015 ACT: 47% (40% in 2014)
Lehigh University
2005 SAT: 98% vs. 2005 ACT: 2%
2016 SAT: 58% (63%) vs. 2016 ACT: 42% (37%)
Princeton University
2005 SAT: 100% vs. 2005 ACT: N/A
2016 SAT: 73% (80%) vs. 2016 ACT: 45% (36%)
Stanford University
2005 SAT: 97% vs. 2005 ACT: 23%
2016 SAT: 77% (80%) vs. 2016 ACT: 51% (51%)
Swarthmore College
2005 SAT: 99% vs. 2005 ACT: 14.9%
2016 SAT: 67.5% (73%) vs. 2016 ACT: 48.7% (46%)
University of Michigan
2005 SAT: 55% vs. 2005 ACT: 66%
2016 SAT: 26% (27%) vs. 2016 ACT 82 (83%)
University of North Carolina-Chapel Hill
2005 SAT: 99% vs. 2005 ACT: 22%
2016 SAT: 71% (76%) vs. 2016 ACT: 78% (74%)
University of Pittsburgh (Pittsburgh campus)
2005 SAT: 99% vs. 2005 ACT: 20%
2015 SAT: 80% (85%) vs. 2015 ACT: 50% (47%)
University of Virginia
2005 SAT: 99% vs. 2005 ACT: 14%
2015 SAT: 77% (82%) vs. 2015 ACT: 50% (44%)
Vanderbilt University
2005 SAT: 89% vs. 2005 ACT: 53%
2015 SAT: 37.6% (41%) vs. 2015 ACT: 67.2% (63%)
Virginia Commonwealth University
2005 SAT: 95% vs. 2005 ACT: 15%
2015 SAT: 81.1% (87.4%) vs. 2015 ACT: 26.4% (26.9%)
Washington and Lee University
2005 SAT: 80% vs. 2005 ACT: 18%
2015 SAT: 37% (46%) vs. 2015 ACT: 63% (53%)
Wesleyan University
2005 SAT: 94% vs. 2005 ACT: 18%
2015 SAT: 58% (61%) vs. 2015 ACT: 41% (38%)
*The most recent Common Data Set posted online is 2015-16
Georgetown dean suggests admissions advantage for students submitting the ‘new’ SAT
Students submitting ACT scores to Georgetown University this year could have been at an admissions disadvantage relative to those submitting results from the new or “redesigned” SAT, according to a statement made last week by Dean of Undergraduate Admissions Charles Deacon.
“A lot of people are advised by their high school counselors maybe to take the ACT, which we don’t think is great advice,” said Deacon in an interview published by The Hoya, Georgetown’s student-run newspaper, in reference to testing strategies used by applicants for fall 2017 admission.
Why would that be? Because Dean Deacon believes, based on what he heard from the College Board, that scores from the redesigned SAT appear higher than those from either the old SAT or the ACT.
And he’s right—sort of. But there’s a reason. In fact, there are several reasons why the scores are higher, including that it’s an entirely different test.
While rumors have circulated for years about Georgetown’s alleged preference for College Board products, this is the first time a statement seeming to confirm the bias has appeared in print. And it comes in the context of transitioning from the “old” SAT, last given in January, 2016, to the redesigned SAT, which debuted in March, 2016.
During the transition to the new test, a large number of students planning to apply for fall 2017 opted to take the ACT, to avoid what appeared to be a significant number of unknowns in content and scoring for the new SAT. Still others took the old SAT for some of the same reasons.
And many took various permutations and combinations of the three tests. But for Georgetown, it seems that students submitting the new SAT might have had an advantage over those submitting only the old SAT or the ACT.
Once initial scores from the new SAT came in and were analyzed by the College Board, a conversion tool was devised and posted online that compared those scores with those from the older test and the ACT.
While the ACT initially protested that the concordance was completed without sufficient study, the resulting comparisons made it clear that students taking the new test were coming in with numerically higher scores than in the past. It didn’t mean they necessarily did better and could look forward to applying to more selective schools. It simply meant the numbers were higher and a translating tool between the old and new tests was necessary to compare applicants.
As a result, a number of test prep organizations and individual colleges devised detailed tables designed to facilitate these comparisons. Princeton Review distributed a quick SAT-ACT comparison table as a bookmark for counselors to keep at their desks. Compass Prep compiled and published “estimated” new SAT score ranges for 360 popular colleges and universities, using most-recently reported old SAT scores translated via concordance into new SAT scores.
According to this translation, Georgetown went from a published midrange of 1320-1500 for the old SAT to an estimated midrange of 1390-1560 for the new SAT. In other words, students taking the new SAT would have to score higher to stay within Georgetown’s most recent 25th-75th percentile of entering freshmen.
But Georgetown evidently didn’t look at it that way. A counselor newsletter circulated last fall said, “We do not plan to use the College Board’s concordance tables to adjust SAT I scores in either direction.” This policy was recently confirmed by a representative from the Georgetown admissions office.
Instead, admissions readers were asked to look at scores “contextually” and without a tool to facilitate comparisons among applicants submitting different tests.
At the same time, The Hoya reported Deacon as noting that Georgetown saw an increased number of students taking and submitting scores for the ACT that looked “lower” when compared to the new, inflated SAT scores. “Deacon said this trend could have hurt students who preferred to submit ACT scores instead of the new SAT scores they received because they considered it to look more impressive.”
Reacting to concerns about any disadvantage suffered by students submitting the ACT only, Dean Deacon, speaking through a representative, said he was concerned that students “traditionally preparing” for the SAT were interrupted in their preparations by counselors who encouraged them to switch to the ACT, and this may have produced lower scores.
In other words, he felt that any harm done was a result of switching tests and not a result of any Georgetown bias produced by failing to recognize the new scale and use concordance tables to translate scores from one test to the other.
James Murphy, the Director of National Outreach for The Princeton Review disagrees, “The decision to treat the new SAT scores as if they are equivalent to the old test is a misuse of the exam, and College Board would be the first to say so. It almost certainly hurt students who applied to Georgetown.”
Georgetown is still working on compiling numbers for the Class of 2021, and admissions results will be mailed by the end of this week.
Admissions data visualized
Once again, self-described “tableau dabbler,” Jon Boeckenstedt, associate vice president for enrollment management at DePaul University, has come up with easy-to-use tools for visualizing basic college admissions data.
Drawing from information compiled in Peterson’s Undergraduate database and the Peterson’s Undergraduate Financial Aid database, both copyright 2016 by Peterson’s-Nelnet, Boeckenstedt has created a series of ten “views” or charts showing test scores, male and female admit rates, early decision vs. regular admit rates, need data as well as some general international student information to be used with caution.
And the colorful “optics” can be very revealing as well as educational for anyone putting together a college list.
For example, by looking at “SAT Math distributions,” it’s very easy to see that an applicant to Caltech with less than a 700 Math SAT has nearly no chance of admission as 98.9 percent of the freshman class entering fall 2015* (the teal-color bar) had math scores over 700 (exact numbers can be found by hovering your mouse over the bar). Judging from ACT Composite distributions, the student with less than a 30 Composite ACT score had no chance of admission to Caltech.
Using the same database, Boeckenstedt lays out 25th and 75th percentiles for SAT CR and Math scores as well as ACT Composites. Looking at the ACT view, for Stanford University, the 25th percentile of the distribution was 31 and the 75th percentile was 35—not too promising for a student with an ACT Composite below 31.
“While test scores are not the primary factor in admissions decisions, these charts can give you a good sense of where you might stand in the applicant pool,” explained Boeckenstedt. “And while you might not eliminate yourself from consideration if your scores are close to the border between one range and another, it’s clear that high scores are an important consideration at many of these institutions.”
Admit rate data, or the percentage of applicants offered admission, is equally interesting. The chart illustrating the difference between admit rates for men and women shows exactly how wide the margin can be. For example, in fall 2015, the admit rate for men at Vassar College was 35.4 percent and for women was 21.5 percent—a significant difference easily visualized by the distance between the purple and orange dots. At Harvey Mudd College, the admit rate for men was 9.4 percent while the admit rate for women was 21.4 percent—the dots are reversed!
But it’s the chart documenting the early decision (ED) and overall admit rates and their difference that could possibly suggest application strategies. In fall 2015, the admit rate for ED candidates at Tufts University was 39.2 percent, but the overall admit rate was only 16.1 percent, suggesting a huge advantage for ED applicants. This is confirmed in the light blue bar to the right of the chart showing the difference between the two rates.
Boeckenstedt warns that it’s important to be realistic about admit rates. “A 15% admission rate does not mean that your chances are one in seven; your chances may be better or worse based on any one of many factors in your file.”And, “if you’re a top student in the applicant pool, your chances are probably better; if not, and if there is nothing else to get your application noticed, your chances are almost certainly worse.”
He goes on to add, “…it’s clear that Early Decision makes the choice about where to apply, and under what plans, even harder.”
All of Boeckenstedt’s charts may be filtered by state. And to navigate the various views, simply click the gray boxes or arrows along the top. Use the scroll bar to move down the view, and hover over any data point to show details.
For the record, all the score information is given in terms of the “old” SAT and not the “new” SAT.
*3/17/17 Correction
Save
Save
Colleges that Require, Recommend, or Seriously Consider SAT Subject Test Results
While most four-year colleges in the United States require that the scores from either the SAT or ACT be submitted as part of a prospective freshman’s application, only a small fraction of four-year colleges in the United States require, recommend, or seriously consider a prospective freshman’s performance on SAT Subject Tests when determining whether or not to accept such an applicant. Below is the list of colleges in the United States where SAT Subject Test scores are required, recommended, or seriously considered for first-year admission. Click on the college’s name to learn more about the college’s exact policy related to SAT Subject Tests – and please see recommended test prep books below this list of colleges.
The best prep books for these tests are those published by the test-maker, the College Board: